SimplyPut is smart.
With a deep understanding of the underlying schema of your data combined with the nuances from your datateam, SimplyPut can be very helpful in answering your questions. below is a few examples of the types of questions and analysis you will have at your disposal.
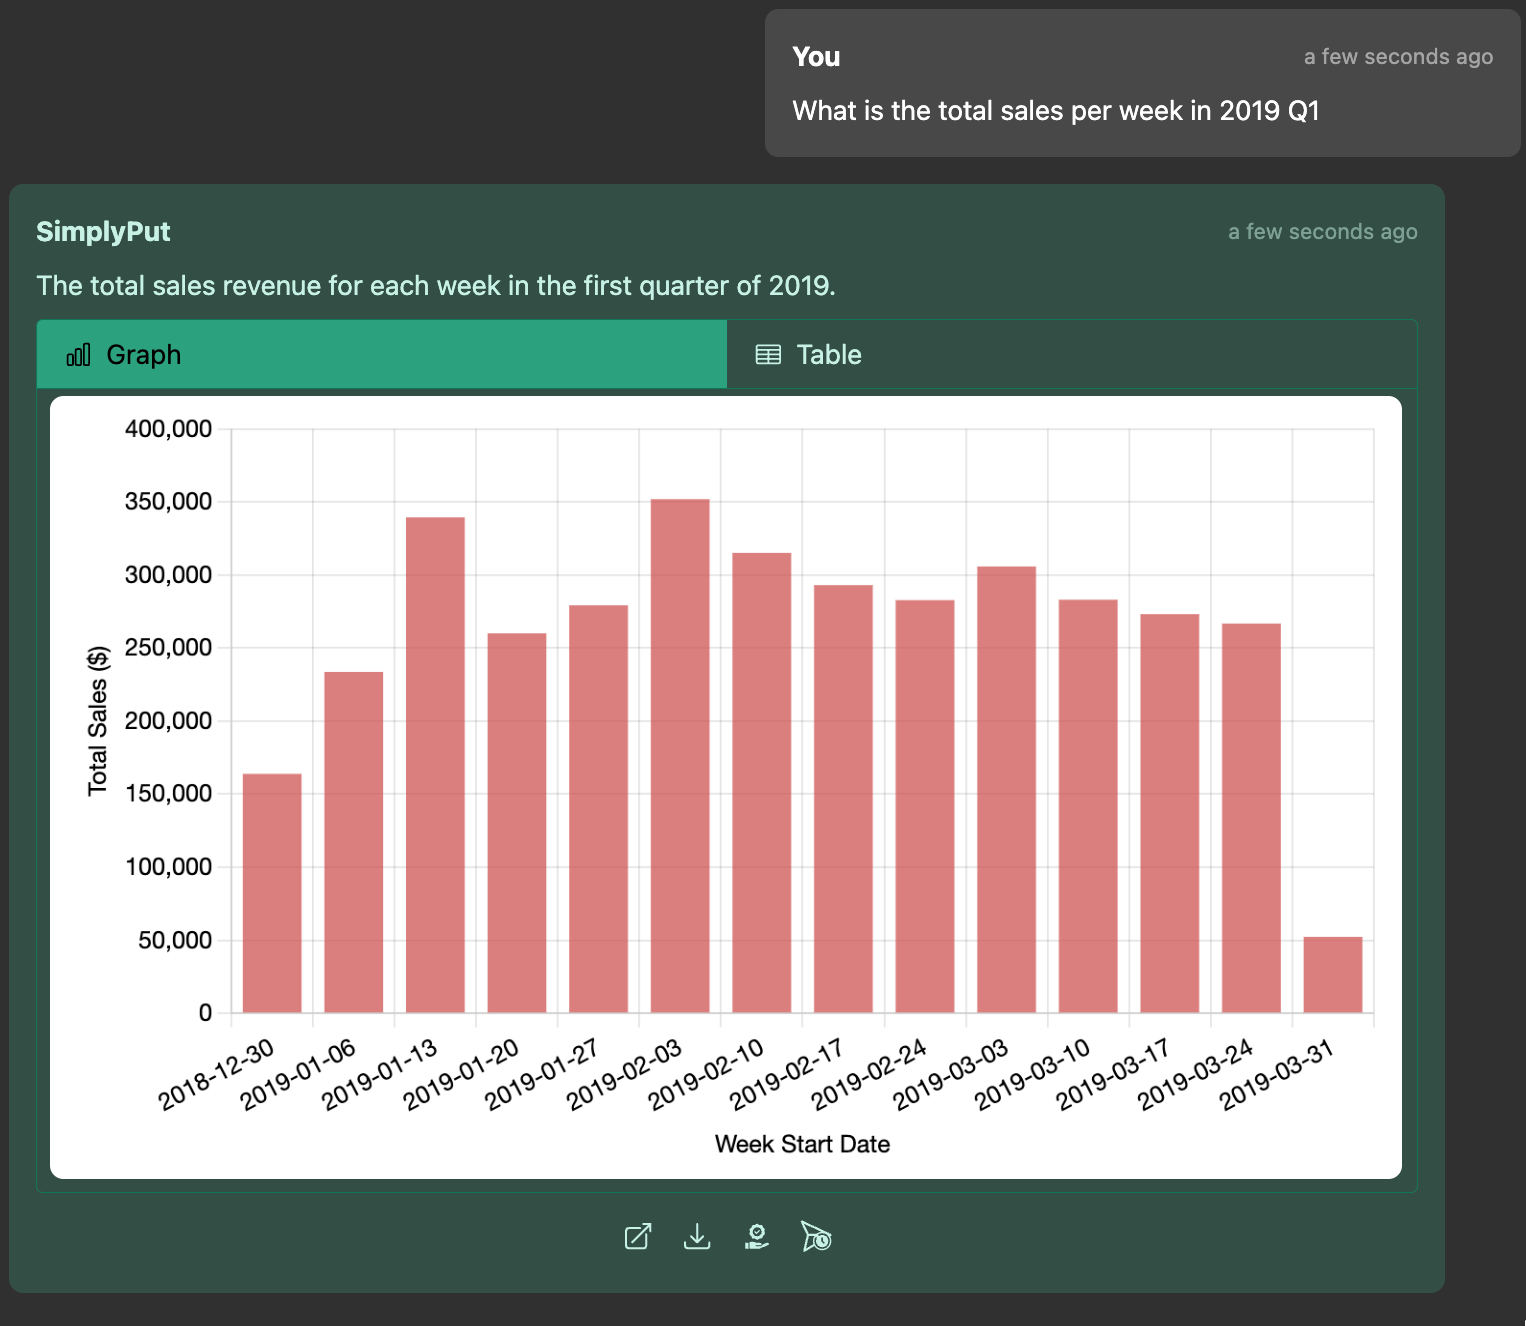
This shows how to get week over week analysis of sales
Phrases that generate it in SimplyPut:
What is the total sales per week in 2019 Q1
SELECT
  FORMAT_DATE('%Y-%m-%d', DATE_TRUNC(sale_date, WEEK)) AS week_start_date,
  ROUND(SUM(revenue), 2) AS total_sales
FROM
  retail_sales.sales
WHERE
  sale_date BETWEEN '2019-01-01' AND '2019-03-31'
  AND revenue IS NOT NULL
GROUP BY
  week_start_date
ORDER BY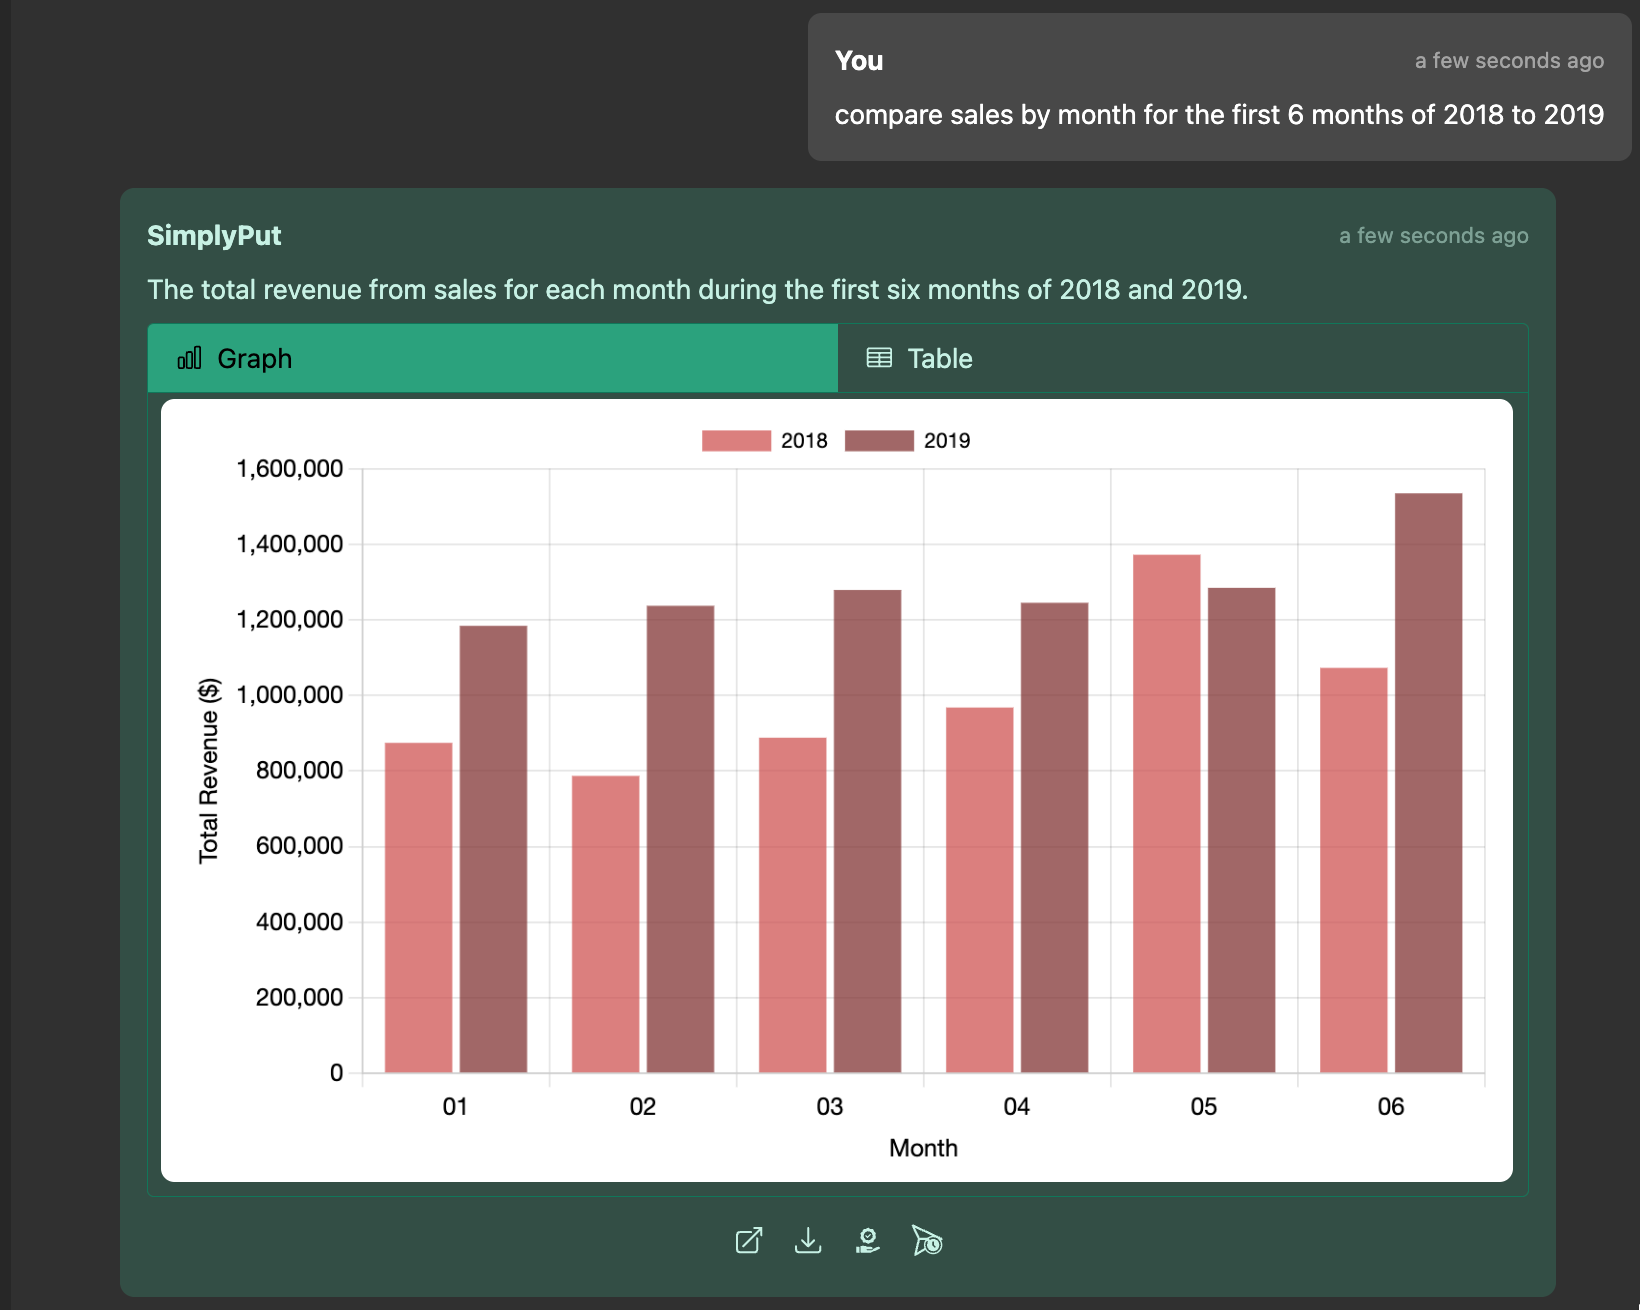
week_start_dateThis compares different time periods against the same time period over another time period.
Phrases that generate it in SimplyPut:
Compare the average sales by month for first four months of this year with the year prior
compare sales by month for the first 6 months of 2018 to 2019
SELECT
    FORMAT_DATE('%Y-%m', sale_date) AS month_year,
  SUM(revenue) AS total_revenue
FROM
  retail_sales.sales
WHERE
  EXTRACT(
    YEAR
    FROM
      sale_date
  ) IN (2018, 2019)
  AND EXTRACT(
    MONTH
    FROM
      sale_date
  ) <= 6
  AND sale_date IS NOT NULL
  AND revenue IS NOT NULL
GROUP BY
  month_year
ORDER BY
month_year ASCThis analysis is used to understand the behavior of various groups of customers over time.
Phrases that generate it in SimplyPut:
Show me the retention rate of customers who signed up in 2018
What is the average revenue of customers who signed up in 2019
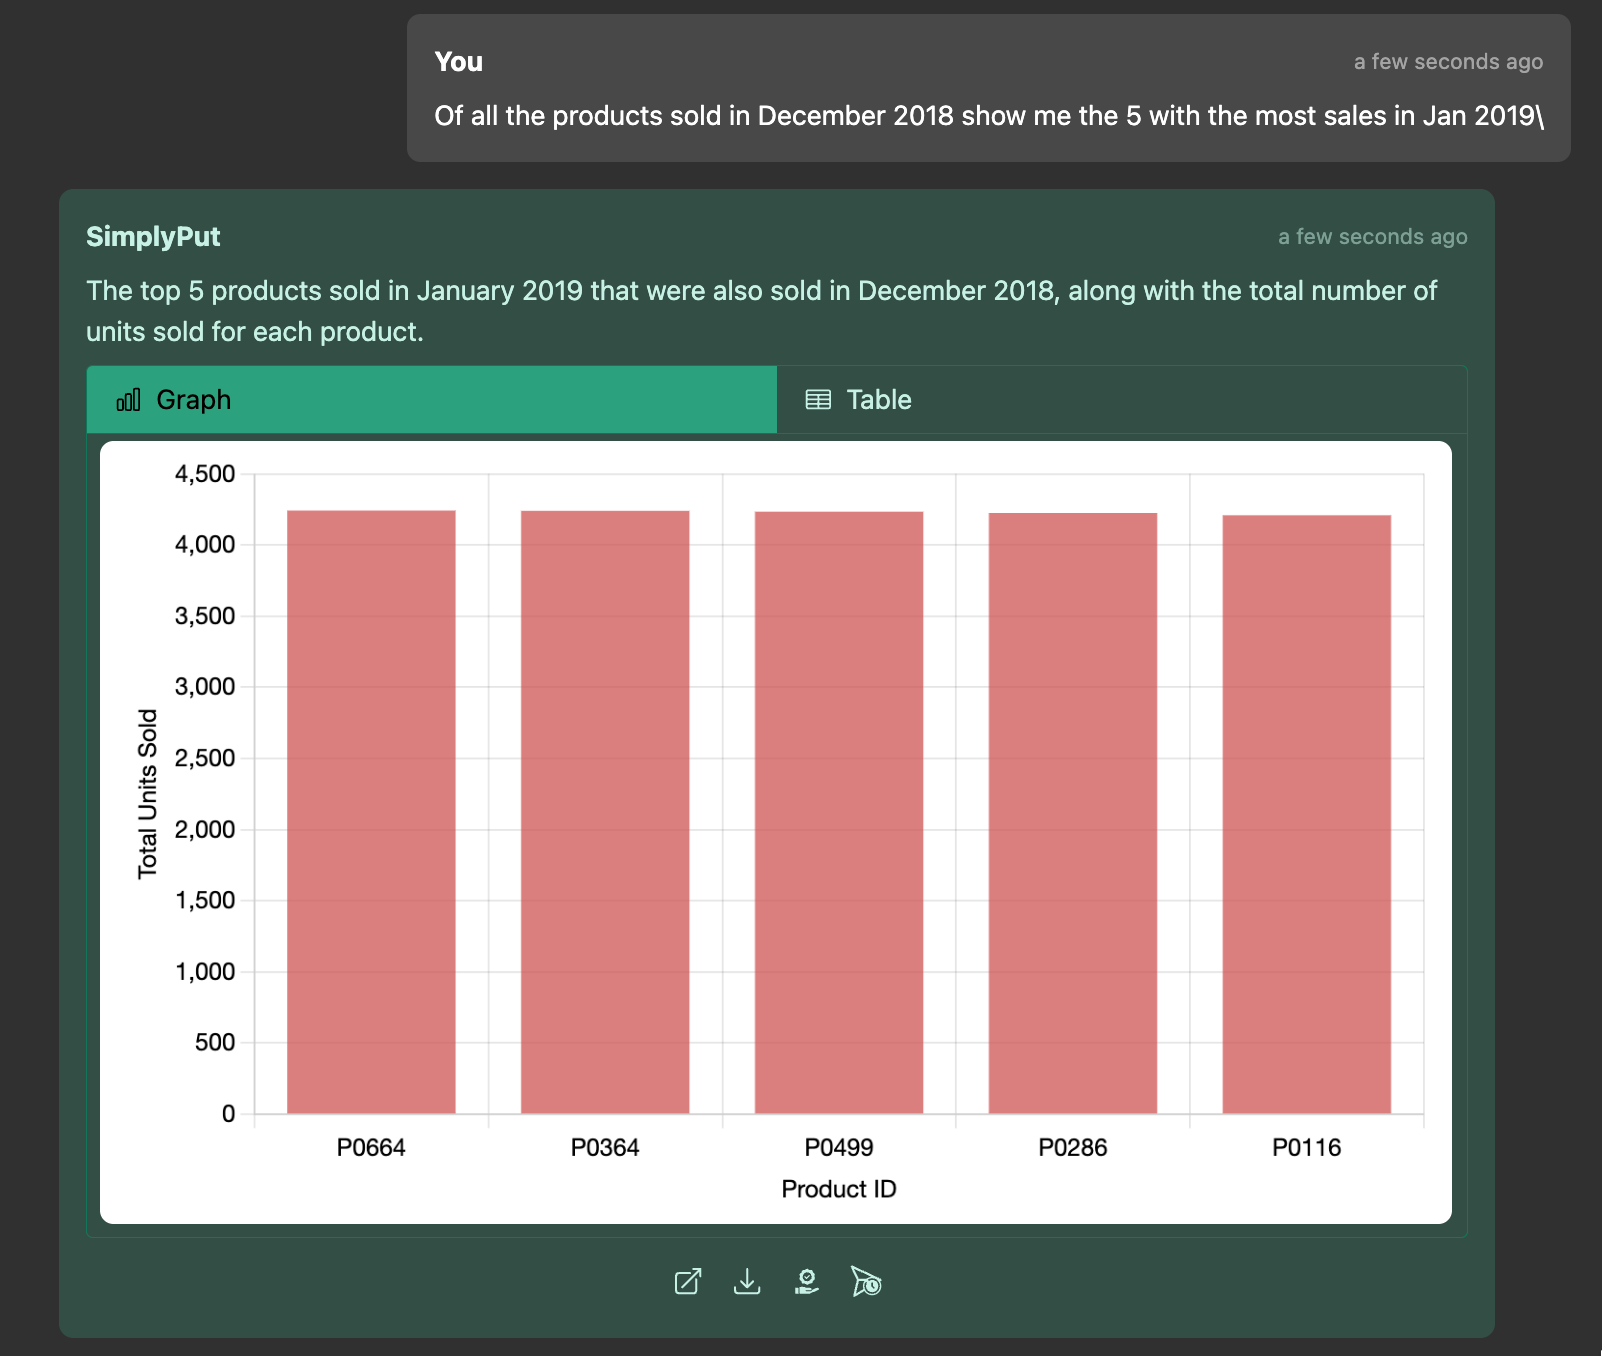
Of all the products sold in December 2018 show me the 5 with the most sales in Jan 2019
WITH
  december_2018_sales AS (
    SELECT DISTINCT
      product_id
    FROM
      retail_sales.sales
    WHERE
      sale_date BETWEEN '2018-12-01' AND '2018-12-31'
  )
SELECT
  s.product_id,
  COUNT(s.num_units) AS total_units_sold
FROM
  retail_sales.sales AS s
  JOIN december_2018_sales AS d ON s.product_id = d.product_id
WHERE
  s.sale_date BETWEEN '2019-01-01' AND '2019-01-31'
GROUP BY
  s.product_id
ORDER BY
  total_units_sold DESC
LIMIT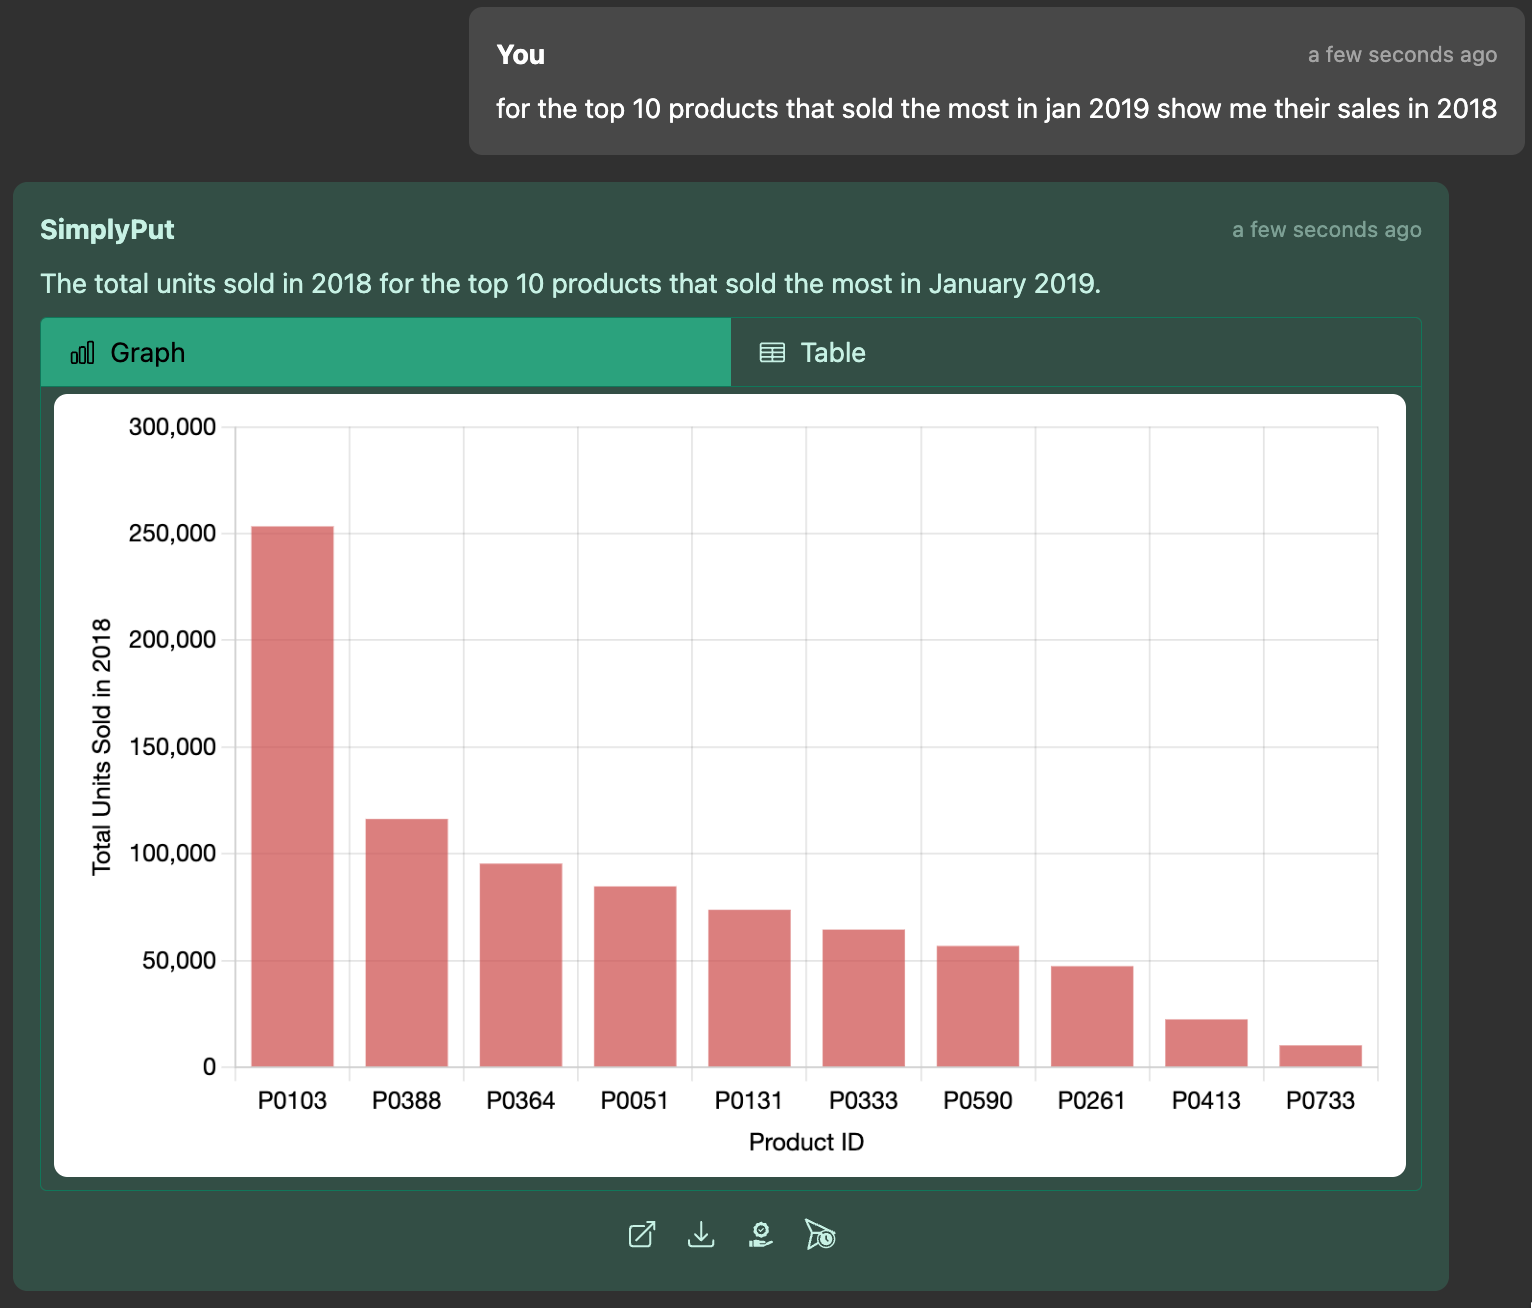
5This analysis is used to understand the behavior of various groups of customers over time.
Phrases that generate it in SimplyPut:
for the top 10 products that sold the most in jan 2019 show me their sales in 2018
WITH
  top_10_products_jan_2019 AS (
    SELECT
      product_id,
      SUM(num_units) AS total_units_sold
    FROM
      retail_sales.sales
    WHERE
      sale_date BETWEEN '2019-01-01' AND '2019-01-31'
      AND product_id IS NOT NULL
      AND num_units IS NOT NULL
    GROUP BY
      product_id
    ORDER BY
      total_units_sold DESC
    LIMIT
      10
  )
SELECT
  s.product_id,
  SUM(s.num_units) AS total_units_sold_2018
FROM
  retail_sales.sales AS s
  JOIN top_10_products_jan_2019 AS t ON s.product_id = t.product_id
WHERE
  s.sale_date BETWEEN '2018-01-01' AND '2018-12-31'
  AND s.product_id IS NOT NULL
  AND s.num_units IS NOT NULL
GROUP BY
  s.product_id
ORDER BY
total_units_sold_2018 DESCThis analysis is used to understand the behavior of various groups of customers over time.
Phrases that generate it in SimplyPut:
show me total revenue, and its 7 rolling average by day in Q1 2019
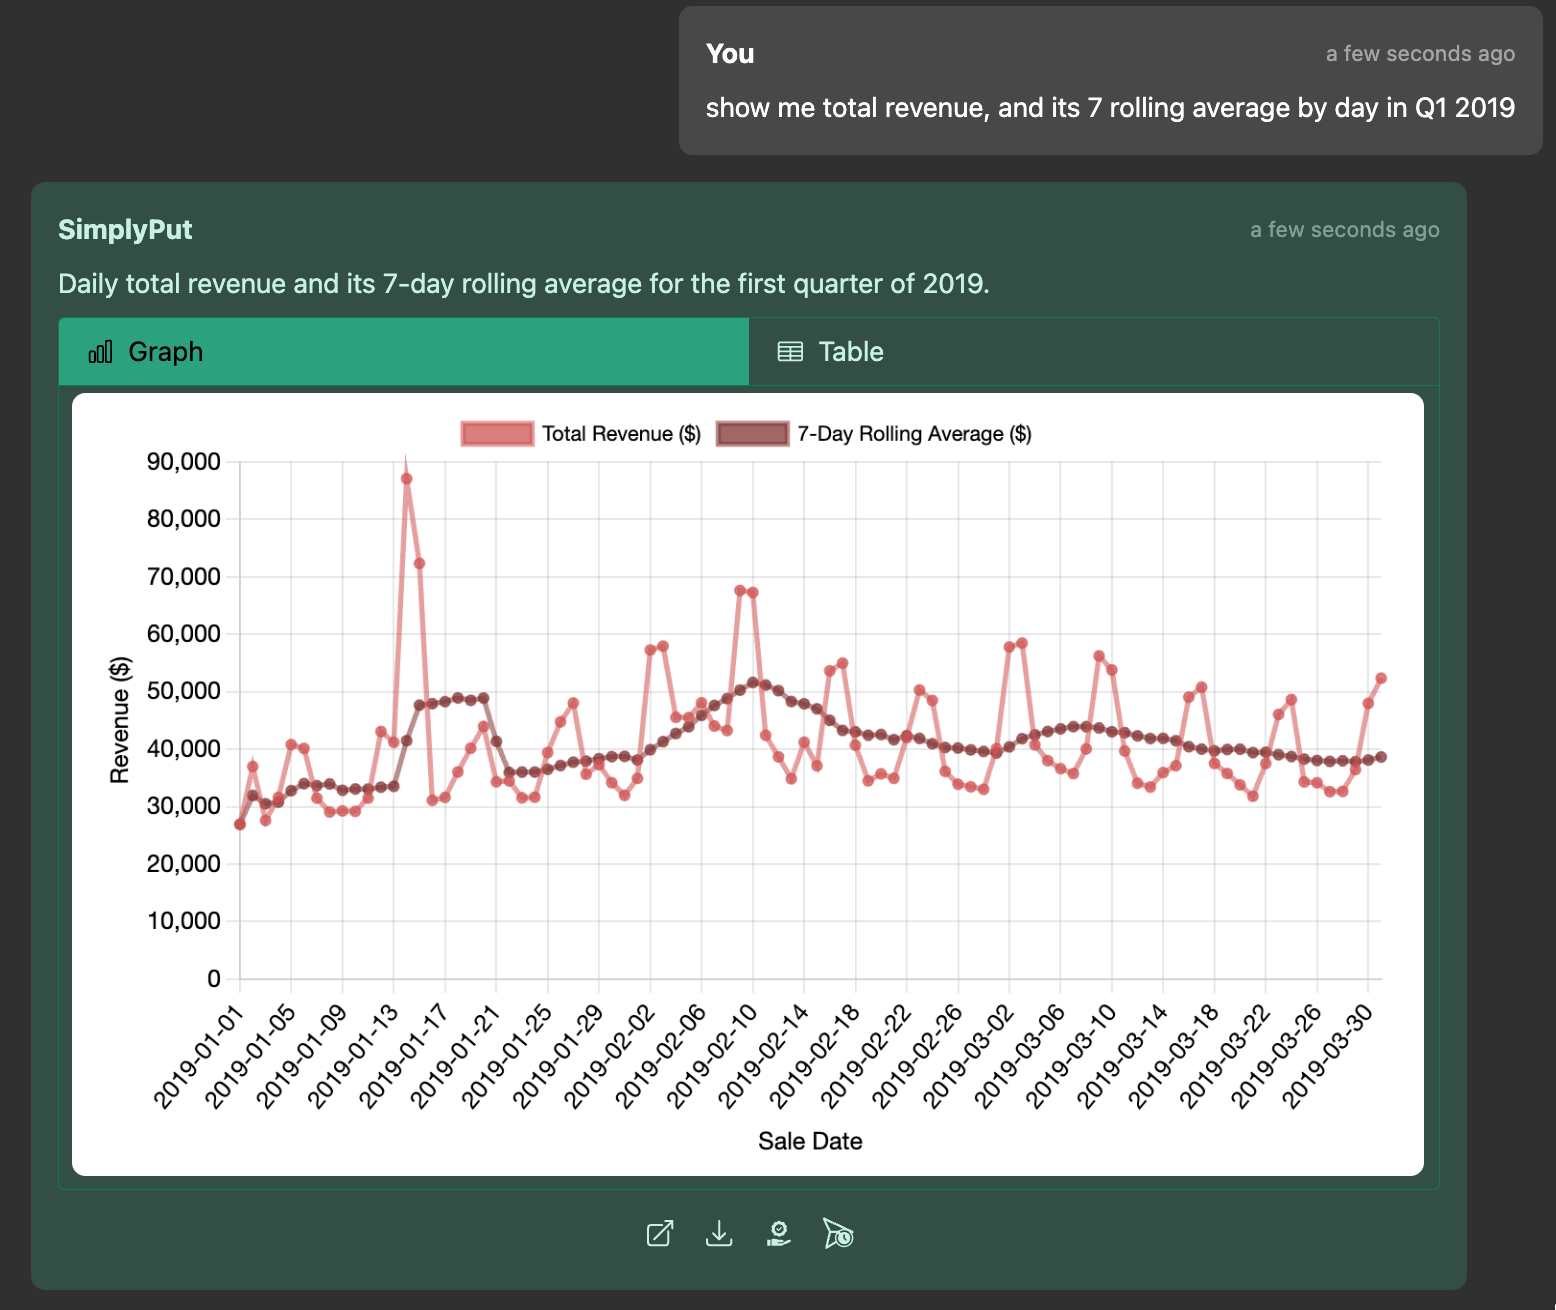
WITH
  daily_sales AS (
    SELECT
      sale_date,
      SUM(revenue) AS total_revenue
    FROM
      retail_sales.sales
    WHERE
      sale_date BETWEEN '2019-01-01' AND '2019-03-31'
    GROUP BY
      sale_date
  )
SELECT
  sale_date,
  total_revenue,
  ROUND(
    AVG(total_revenue) OVER (
      ORDER BY
        sale_date ROWS BETWEEN 6 PRECEDING
        AND CURRENT ROW
    ),
    2
  ) AS rolling_avg_7_days
FROM
  daily_sales
ORDER BY
sale_dateThis analysis is used to understand the behavior of various groups of customers over time.
Phrases that generate it in SimplyPut:
for each city show the total revenue and the average price in a scatter plot
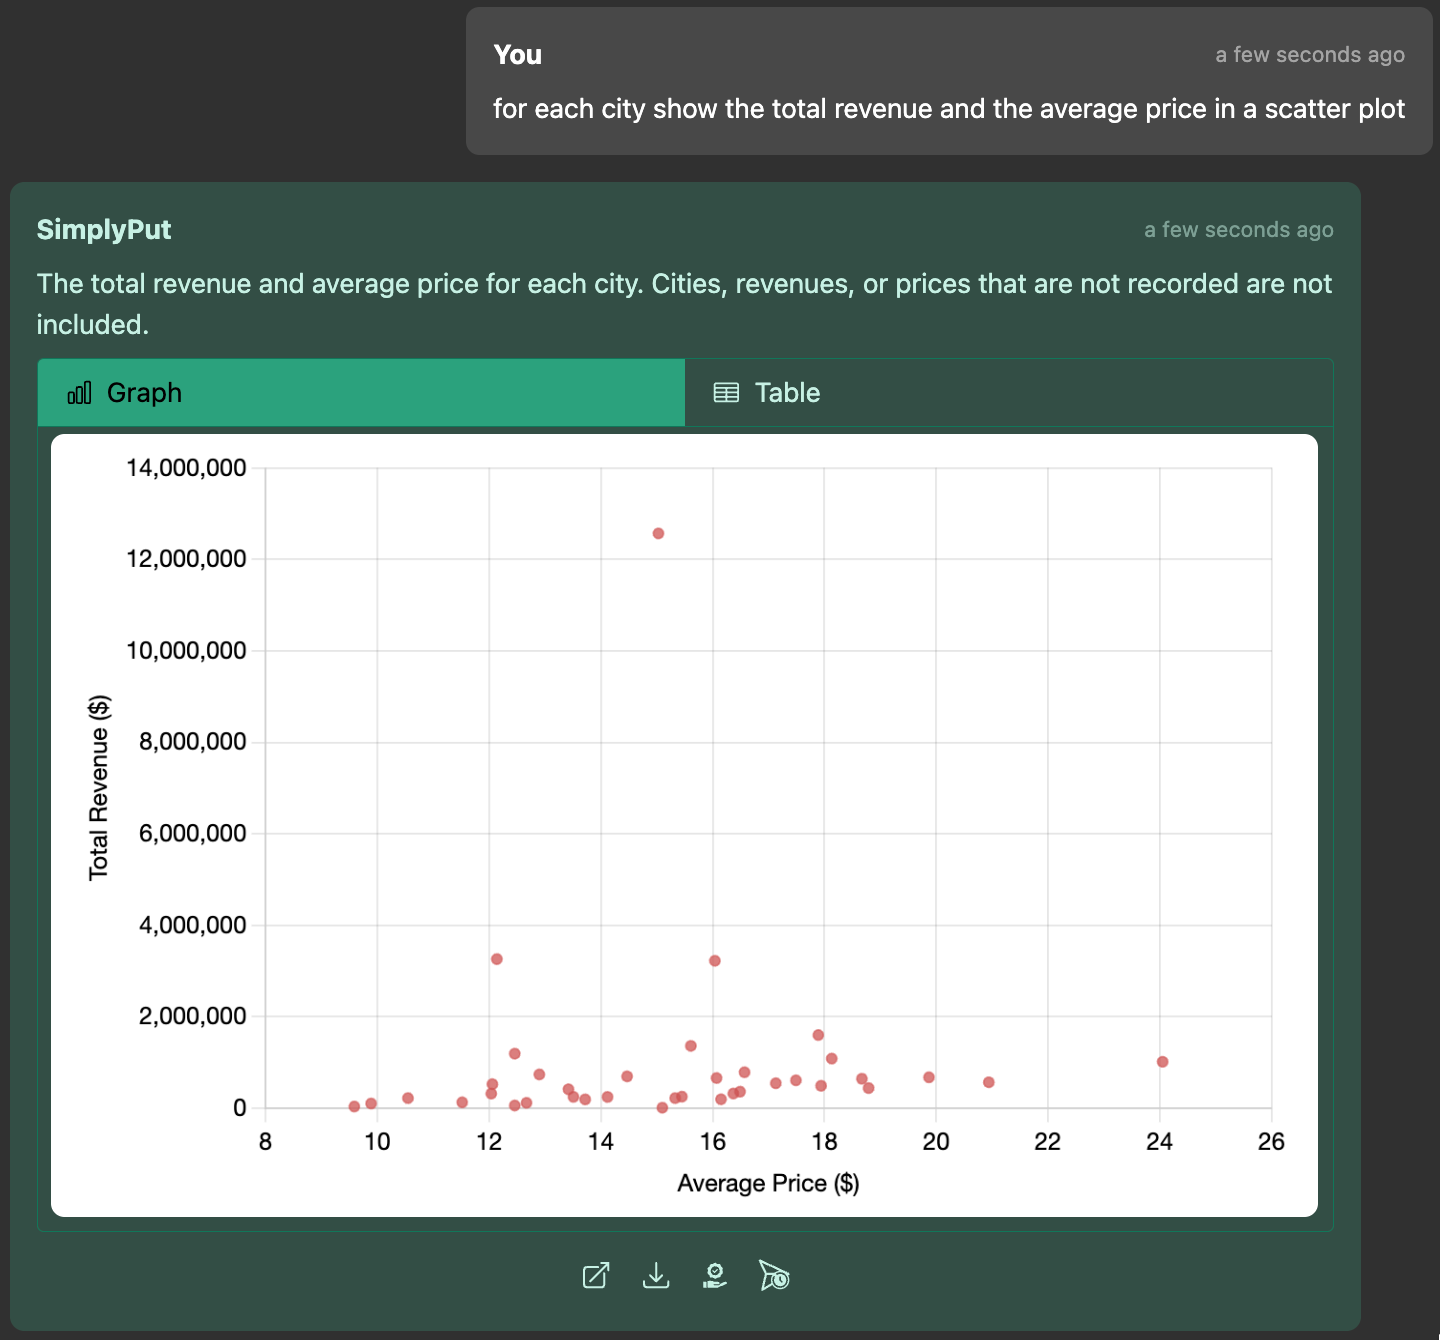
SELECT
  sc.city_id,
  SUM(s.revenue) AS total_revenue,
  ROUND(AVG(s.price), 2) AS average_price
FROM
  retail_sales.sales AS s
  JOIN retail_sales.store_cities AS sc ON s.store_id = sc.store_id
WHERE
  s.revenue IS NOT NULL
  AND s.price IS NOT NULL
  AND sc.city_id IS NOT NULL
GROUP BY
  sc.city_id
ORDER BY
  sc.city_id
LIMIT
  3000